
Figure 22: Portfolio composition of Ethna-DYNAMISCH by issuer sector

Bumpy Landing
No high flyers left! All planes must land at some point, but sometimes the landing is a bumpy one and the passengers become queasy. The same goes for the global economy. What goes up must come down. Younger readers might not know this because the last recession in the most important economy in the world, the U.S., happened 126 months ago: a record! It is often argued that the sheer length of time means that a recession is imminent but, just as often, reality has gone against this argument. And it’s hard to argue with reality. At the moment it really does look like we have begun our final descent and the outlook is for a pretty bumpy landing.
We traditionally¹ start the new year with a review, and this year is no different. Exchange rates have brought a considerable measure of volatility to the markets. Of course in retrospect it’s easy to see where and, above all, how there was money to be earned in 2018, but hindsight is always 20/20. On the currency front, we should only have bought USD or even JPY and simply let it sit in an account, where it would have returned more than 5%. This would not have worked at all in the case of emerging market currencies, considering how the Russian rouble (-11%), the Turkish lira (-24%) and the Argentine peso (-49%) fared.

Figure 1: Currency gains/losses against the euro (as at 27/12/2018).

Figure 2: Currency over/undervaluation as measured by the BigMac Index (as at 27/12/2018).
Perhaps Figure 2 will enable us to predict what way exchange rates will go in 2019. We will not even attempt to make predictions for the Swiss franc, the Norwegian krone or the Swedish krona because these currencies have always been distinctly overvalued in the past 15 years (this index has been in existence for this length of time). Of course, this may just mean that the classic American hamburger is simply wildly expensive in these countries. In any case, the U.S. dollar is more relevant to us, which is overvalued by almost 24% against the euro. Without giving away too much of what’s to come, we believe the dollar will tend to weaken in 2019. The pound sterling, too, although already undervalued by almost 10%, is likely to continue to lose ground against the euro unless either Brexit is called off or Theresa May’s deal is passed by the UK parliament. However, the British government does not seem all that confident. It is chartering extra ferries for the English Channel, it has 3,500 soldiers on standby⁴ to keep the peace and it is forcing certain companies to sign non-disclosure agreements⁵, no doubt to prevent people from stockpiling food and medication. This doesn’t suggest that May’s government truly believes that her Brexit deal will succeed. For this reason, the pound sterling is likely to continue to lose value.

Figure 3: Main equity index return in local currency in 2018 (as at 27/12/2018).
2018 was not an easy year for equities either (see Figure 3). Not only the VIX crash in February 2018 caused headaches for equity investors; but also the sell-off in the second half of the year led to steep losses. Even the potential return on the Brazilian stock market of around 11% was negated by the 11% fall in the BRL (see Figure 1). There were very few places to hide from the turbulence.
Bond investors are also suffering from a hangover after 2018. The bond markets didn’t present many opportunities not to lose money either (see Figure 4). Only four of the 15 indices observed were up, but just barely so, at less than 0.5%. The remainder of the bond markets closed well inside negative territory. Add to that the cost, in euro, for currency hedging, then we get a rough picture of what we’re dealing with. The premiums for corporate bonds increased sharply. Investment grade premiums – both in euro and in U.S. dollar – rose 60 basis points over the year. This boils down to a loss of approximately 5% for a 10-year corporate bond. In the non-investment grade segment, losses were even more pronounced. While the premiums on bonds denominated in U.S. dollars widened 150 basis points, they widened a hefty 230 basis points in the euro segment. In these examples, this would mean losses of more than 7.5% and even more than 11%, respectively. This may remind some readers of the years 1994 and 1999.

Figure 4: Selected bond index returns in local currency in 2018 (as at 27/12/2018).
It’s time now to look ahead. 2018 was difficult for investors; will 2019 be any easier? Probably not, we think. The aforementioned turbulence will make a smooth landing difficult but not impossible. We will stick with the aviation analogy for our forecast. Let’s start with Asia.
In two of the first three quarters of 2018, Japan’s economic growth was negative. Flying on one engine, Japan is not expected to soar in 2019 despite the best efforts of the government and the central bank. Japan’s share of global GDP is roughly 6%.
According to official channels, China is flying at a similar altitude, with 6.5% economic output. However, no one can say for sure because the government in Beijing has covered over the instruments in the cockpit. In any case, the trend is falling, even for official economic growth. It wasn’t until the very last day of 2018 that the official purchasing managers’ indices fell below 50 for the first time in two and a half years. China represents 13% of global GDP.
Moving on to the eurozone, accounting for a none too shabby almost 18% of global GDP, we will look first at its biggest economy, Germany, which generates around one third of the entire economic output. Figure 5 shows the changes in German GDP. The third quarter of 2018 was a weak one, with an annualised figure of -0.8% QoQ. These figures will improve, however, since certain one-off effects in the automotive sector, which is very important for Germany, will have no further impact. The German plane has lost altitude but is still airborne. We do not yet have the exact figures but the assumption is roughly 1.6%. However, the figure for the third quarter of 2018 came as a surprise to many. The eurozone as a whole isn’t really any better off than Germany. Germany is going through a weak phase, at least. France’s economy is growing at an annualised rate of 1.6% QoQ but the yellow vest protests will stymie the will to reform. Italy’s plane had a bumpy third quarter, similar to Germany, with an annualised rate of -0.4% QoQ. The fact that a coalition of right- and left-wing populists is in power makes it very unlikely that the urgently needed economic reforms will be carried out. There is a good chance that the Italian plane will touch down in the coming quarters. Spain, too, is not harbouring any major surprises. In conclusion, the eurozone plane is in the air but losing altitude despite the European Central Bank’s efforts to keep it aloft. If the afterburner that is the asset purchase programme goes out from the beginning of 2019, then it remains to be seen whether the plane will lose altitude faster. If an interest rate rise reduces the power a notch as of mid-year, the heavy, not very aerodynamic plane could end up on the tarmac very soon after.
So far, we have painted quite dim prospects for Japan, China and the eurozone. Together they make up 37% of global GDP. Unless Brexit turns out for the best for the UK in the end, there are difficult times ahead for another 3% of global GDP – regardless of what the Bank of England intends to do. Whatever it does, it won’t stand idly by.
Now we turn to developments in the most important and biggest economy in the world, the U.S., which produces 20% of global GDP. 

Figure 5: German GDP.

Figure 6: U.S. GDP.

Figure 7: Probability of recession in the U.S. in the next 12 months, according to the New York Fed.

Figure 8: Recessions and yield curve steepness in the U.S.
Figure 6 shows the changes in U.S. GDP. At first glance, it seems premature to talk of a risk of recession. A very strong Q2 2018 was followed by a slightly weaker Q3 2018, with growth at 3.5%. However, we should mention at this point that the widely known estimates of the New York and Atlanta branches of the Fed are only 2.5% and 2.7%, respectively, for Q4 2018. Note that these figures are the annualised quarter-on-quarter growth rates. Real quarterly growth is therefore around 0.6% and thus not miles away from the European growth rate. However, what strikes us as much more significant is the distinct slowdown in economic growth. The American plane is losing altitude. Of course, this is precisely what the central bank wishes. The U.S. central bank has raised the key rate – that is, throttled back – nine times. The effects of this were priced in. U.S. President Trump, however, seems to have already used up any fuel reserve he may have had to give the plane a further boost. Tax relief for corporates, reducing red tape and environmental protection, and many other similar measures favourable to business have already been implemented and are thus history for now. His politics of isolation, his immigration policy, his trade policy and finally the government shutdown due to his insistence on a physical wall along the border with Mexico are crosswinds, if not outright headwinds, for the U.S. economy. The fact that Trump has almost completely shut himself off from expert knowledge by dismissing expert advisors and top-level officials or prompting them to resign makes his politics by twitter more unpredictable. In an interview with the Washington Post newspaper at the end of November 2018, he went as far as saying that his gut tells him more sometimes than anybody else’s brain can ever tell him⁶. A telling statement, which clearly reveals his opinion of himself, especially considering that this man has access to the biggest nuclear arsenal in the world.
Despite the current economic numbers, which are still good, the probability of a recession in the U.S. is increasing. Figure 7 shows the modelled probability of a recession in the next 12 months to be 16%: it has not been that high since 2006. Figure 8, too, which shows the interest differential between the 10-year and 2-year U.S. Treasury yield, indicates a distinct rise in the risk of recession in the next four to six quarters. Other soft indicators point to a slowdown (see Figures 9 & 10). One could draw on any number of data sets. Many have one thing in common: they show that American growth is slackening. We cannot definitively say how strong this new trend is or when the U.S plane will land on the runway. The fact is that there are many indications at the moment that this is likely to happen by summer 2020.
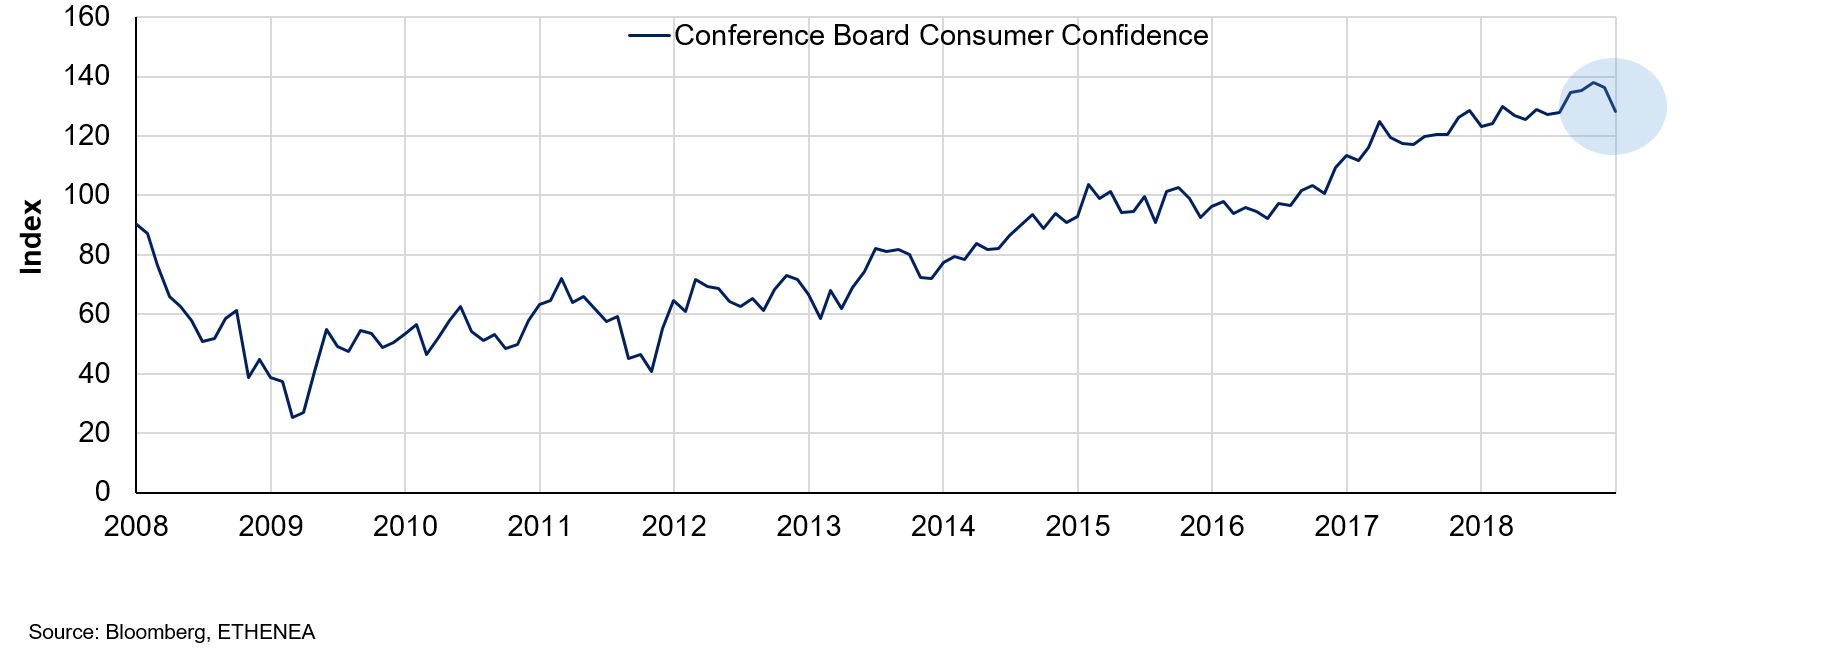
Figure 9: Consumer confidence in the U.S.

Figure 10: Leading indicators in the U.S.
This leads us to conclude that, in all likelihood, at least 60% of the global economy will weaken in 2019. It remains to be seen whether the ECB will actually raise the key rate in an environment such as this. For the capital markets, at any rate, this does not bode well. The Goldilocks⁷ scenario is very far off and we have a lot of uncertainty on our plates. There are numerous indications that 2019 will turn out to be no more than a continuation of last year, which, just from a strictly factual point of view, is correct. The volatility we experienced in H2 2018 will continue and it will remain difficult to find trends with all the movement. We are inclined to see lower yields in the U.S. and probably no rise in yields in core eurozone countries for the time being as well. Whether or not global equity markets can be a source of joy undoubtedly depends to a large extent on developments in the trade conflict between the U.S. and China, but not only that: more and more other factors will push to the fore and ensure that a steady hand is required to manage risks. On that note, we wish all our readers health and success in 2019. Please ensure that your seat belt is fastened and your tray-table is stowed.
¹ The fact that our January Market Commentary is now in its 11th year, makes it one of our company traditions.
² The BigMac Index seeks to measure purchasing power by comparing the price of a Big Mac in every currency region, on the assumption that the same product should cost the same everywhere.
⁴ https://www.welt.de/wirtschaft/article185754072/No-Deal-Brexit-Notfallplan-mit-3500-Soldaten.html
Market outlook 2019: farewell to price targets!
How reliable are start-of-the-year predictions of year-end equity index figures? We don’t think such forecasts are possible. Christian Schmitt looks back on a volatile 2018 and explains why the Ethna-DYNAMISCH puts investors in a good position in 2019 as well.If you are having video playback issues, please click HERE.
Positioning of the Ethna Funds
Ethna-DEFENSIV
December 2018 was challenging, much like the two months prior. The market was characterised by volatility and high losses on the risk assets equities and corporate bonds, particularly those with low ratings. The long-awaited year-end rally in equities failed to materialise, so ultimately 2018 will not go down in the history books as a good year for the stock markets.
Despite the opposing trend in spreads and yields the Ethna-DEFENSIV managed to achieve a positive monthly return of 0.13% for corporate bonds thanks to its long duration.
To ensure a successful start to 2019, the modified duration was increased further to its current level of 7.48. The average rating in the unchanged, high bucket of between AA- and A+ will limit potential losses if the sell-off in corporate bonds continues.
In relation to currency and equity risk, our approach is still to wait for the right entry point before investing once more.
Ethna-AKTIV
The mood on the capital markets last month can be encapsulated in these two words: risk off! December’s soaring risk aversion manifested in the marketplace in a steepening of the downtrend in global equity indices and increasingly higher corporate bonds spreads. The post-G20 euphoria was evidently no more than a flash in the pan. While the ECB, as expected, decided to end the asset purchase programme and left key rates unchanged, the Fed caused disappointment following its regular meeting by announcing forthcoming rate rises, which signalled that interest rates would rise more slowly in 2019. The majority of market players had obviously anticipated an imminent end to the Fed’s rate hikes due to the slowdown in economic growth. The market interpreted this signal as a failure to respond and as a sure step towards a policy error on the part of the central bank. This, combined with the fresh unrest in the White House, resulted in December’s performance being the worst in decades for the S&P500.
The opportunity to take profits on short-term gains, as we had anticipated in last month’s market commentary, simply did not arise. Instead, we continued to proactively adjust the fund to the situation over the course of the month. The most important measures taken were, firstly, extending the duration by means of futures in U.S. Treasuries, in order to benefit from their being a safe-haven asset. Secondly, we successively reduced the equity allocation, culminating in the establishment of a short position of approx. 5% net during the last few weeks of 2018. As part of these risk-adjustment efforts and also considering that economic numbers were weaker again, we distanced ourselves from our Chinese equities position for the time being. As long as the unrest on the global capital markets persists, this positioning will protect the fund from further price losses and might even bring about price gains.
These measures enabled us to keep fund losses below 1% in what were difficult circumstances. The main driver behind performance was the equity portfolio, with a contribution of -82 basis points. The substantial adjustment in the equity exposure protected the fund from much greater losses. We should mention the bond portfolio contribution, as it closed December slightly up despite higher risk premia for corporate bonds. What this comes down to is, firstly, the improvements in portfolio quality and stability we made in the months prior and, secondly, the aforementioned extension of duration by way of U.S. interest futures.
Looking ahead, it is safe to say that the first cracks in the big picture fundamentals are very much visible but that, for the moment, there are no signs of an imminent recession. Therefore, in our opinion, opportunities may again arise – as soon as the market environment permits – to leave the risk aversion and capital preservation mode. Our flexible approach, the very good liquidity and the high quality of the portfolio make for a robust foundation on which to do so.
Ethna-DYNAMISCH
It has been a turbulent year for stock markets and we have again seen strong movements in December in particular. For equities, 2018 will undoubtedly be remembered for the market separation as well as for the general falls in prices. While the U.S. managed to escape the downtrend for a long time, Asian and European equity markets have been floundering since February. Up until the first few days of December, there was every reason to believe that U.S. stock markets would be up for the year. By then, European and Asian indices were already so far in negative territory as to be beyond hope. The situation changed abruptly mid-December, when a spate of wholesale selling gripped the markets. Unlike in previous months, this time it was mainly U.S. stock markets that came under pressure and the finger of blame was soon pointed at the U.S. central bank. Although the rate rise in December had been priced in, market players had hoped for a clear signal that monetary policy would be loosened going forward. The tone of the Fed’s announcement signalled moderation but made it clear that the U.S. economy is growing strongly. Therefore, further rate rises could not be ruled out, to which the market responded with strong losses in the days leading up to Christmas. There and then, the anticipated year-end rally turned into an end-of-year sell-off. Given the weak December, most U.S. indices now found themselves in a bear market as well because losses since the all-time high had exceeded the 20% mark. We would like to go into further detail on how the Ethna-DYNAMISCH did in this environment:
- The fund equity allocation made leaps of similar magnitude to the underlying indices. With the economy continuing to worsen, we sold further cyclical equities. As early as the beginning of December, we sold off our entire share holdings in UPM Kymmene, Renault and Freenet. Due to the emerging tensions in the market, the proceeds were not reinvested; instead, the cash position was expanded. In addition to the active sales within the portfolio, one Dax futures hedge amounting to 5% was placed. As a result of the aforementioned measures and the sharp increases in the price of options in some cases, the equity allocation fell to a mere 30% for a time. The Dax hedge was reversed at a good profit before Christmas. Some of the put options, the price of which had increased sharply, were also sold. Due to the temporary reduction in hedging, the equity allocation at the end of the month was up again to almost 40%.
- Our caution with regard to bonds paid off in December. Many of the securities sold over the course of the year made steep losses in the final days of the year, especially those in the high yield segment. The risk premia on European high yield bonds got close to their 2015/16 highs. We expect the risk/reward ratio on these to improve greatly and are still watching developments. If opportunities arise, we will be able to take them thanks to our high cash holding. Our position in long-dated U.S. Treasuries was up. Triggered by the uncertainties on the equity market, yields in the U.S. fell a good deal, which pushed up prices commensurately. The 30-year yield fell from a high of 3.45% in November to almost 3% in December. The U.S. Treasuries position, which was originally approx. 10%, was reduced to just under 6% in December.
- The price of gold benefited from the global uncertainties and increased contrary to the market trend. Long-term, the gold trend is still rather poor; we do not intend to expand the position in the near term. Amounting to approx. 2% of the portfolio, the gold position had a slightly positive effect on the portfolio.
The starting conditions for 2019 are extremely difficult. What was initially a correction turned into a bear market, which caused losses of 30% or more in some cases in Europe and Asia. Losses in the U.S. are in the region of approx. 20%. Similar to 2011 or 2015/16, a bear market takes a few months to bottom out. The nervousness will not go away overnight and is certain to remain intact in the first quarter of 2019. However, the fall in prices offers increasingly attractive opportunities to get in on good, quality names. At the beginning of 2018, we mentioned multiple times in our market commentaries that valuations, especially of growth equities, were (too) high. Following the sell-off on the global stock markets, valuations in the U.S. have returned to normal and are now slightly below the historical average. In Europe and Asia, valuations are now well below average for recent years. In principle, this is a promising starting point for a successful 2019 for the stock markets. The crucial question for the new year will be economic growth. According to statements from the U.S. central bank in December, the U.S. is in a sustained growth cycle, which does not suggest any significant short-term weakness. In China, the first stimulus packages, similar to 2015/16, are likely to be adopted, which should support the market in the Far East. In light of these conditions, we will see how we go with the Ethna-DYNAMISCH and manage the risk allocations accordingly. In the medium term, we intend to maintain the significant equity allocation in the portfolio.

Figure 11: Portfolio ratings for Ethna-DEFENSIV

Figure 12: Portfolio composition of Ethna-DEFENSIV by currency

Figure 13: Portfolio structure* of Ethna-AKTIV

Figure 14: Portfolio composition of Ethna-AKTIV by currency

Figure 15: Portfolio structure* of Ethna-DYNAMISCH

Figure 16: Portfolio composition of Ethna-DYNAMISCH by currency

Figure 17: Portfolio composition of Ethna-DEFENSIV by country

Figure 18: Portfolio composition of Ethna-AKTIV by country

Figure 19: Portfolio composition of Ethna-DYNAMISCH by country

Figure 20: Portfolio composition of Ethna-DEFENSIV by issuer sector

Figure 21: Portfolio composition of Ethna-AKTIV by issuer sector

* “Cash” comprises term deposits, call money and current accounts/other accounts. “Equities net” comprises direct investments and exposure resulting from equity derivatives.
Please contact us at any time if you have questions or suggestions.
ETHENEA Independent Investors S.A.
16, rue Gabriel Lippmann · 5365 Munsbach
Phone +352 276 921-0 · Fax +352 276 921-1099
info@ethenea.com · ethenea.com
This marketing communication is for information purposes only. It may not be passed on to persons in countries where the fund is not authorized for distribution, in particular in the USA or to US persons. The information does not constitute an offer or solicitation to buy or sell securities or financial instruments and does not replace investor- and product-related advice. It does not take into account the individual investment objectives, financial situation, or particular needs of the recipient. Before making an investment decision, the valid sales documents (prospectus, key information documents/PRIIPs-KIDs, semi-annual and annual reports) must be read carefully. These documents are available in German and as non-official translations from ETHENEA Independent Investors S.A., the custodian, the national paying or information agents, and at www.ethenea.com. The most important technical terms can be found in the glossary at www.ethenea.com/glossary/. Detailed information on opportunities and risks relating to our products can be found in the currently valid prospectus. Past performance is not a reliable indicator of future performance. Prices, values, and returns may rise or fall and can lead to a total loss of the capital invested. Investments in foreign currencies are subject to additional currency risks. No binding commitments or guarantees for future results can be derived from the information provided. Assumptions and content may change without prior notice. The composition of the portfolio may change at any time. This document does not constitute a complete risk disclosure. The distribution of the product may result in remuneration to the management company, affiliated companies, or distribution partners. The information on remuneration and costs in the current prospectus is decisive. A list of national paying and information agents, a summary of investor rights, and information on the risks of incorrect net asset value calculation can be found at www.ethenea.com/legal-notices/. In the event of an incorrect NAV calculation, compensation will be provided in accordance with CSSF Circular 24/856; for shares subscribed through financial intermediaries, compensation may be limited. Information for investors in Switzerland: The home country of the collective investment scheme is Luxembourg. The representative in Switzerland is IPConcept (Suisse) AG, Bellerivestrasse 36, CH-8008 Zurich. The paying agent in Switzerland is DZ PRIVATBANK (Suisse) AG, Bellerivestrasse 36, CH-8008 Zurich. Prospectus, key information documents (PRIIPs-KIDs), articles of association, and the annual and semi-annual reports can be obtained free of charge from the representative. Information for investors in Belgium: The prospectus, key information documents (PRIIPs-KIDs), annual reports, and semi-annual reports of the sub-fund are available free of charge in German upon request from ETHENEA Independent Investors S.A., 16, rue Gabriel Lippmann, 5365 Munsbach, Luxembourg, and from the representative: DZ PRIVATBANK AG, Niederlassung Luxemburg, 4, rue Thomas Edison, L-1445 Strassen, Luxembourg. Despite the greatest care, no guarantee is given for the accuracy, completeness, or timeliness of the information. Only the original German documents are legally binding; translations are for information purposes only. The use of digital advertising formats is at your own risk; the management company assumes no liability for technical malfunctions or data protection breaches by external information providers. The use is only permitted in countries where this is legally allowed. All content is protected by copyright. Any reproduction, distribution, or publication, in whole or in part, is only permitted with the prior written consent of the management company. Copyright © ETHENEA Independent Investors S.A. (2026). All rights reserved. 07/01/2019